Small-Caps Are Correcting: Should Investors Be Worried? What Should They Do?
.jpg)
In the last few months, small-cap funds have been the most favoured segment of retail investors. Small-cap mutual fund schemes have been attracting a lot of fund inflows from retail investors. On 7th February 2024, the Nifty Smallcap 250 Index hit an all-time high of 15,489. Since then, the index has corrected a little over 10% as of March 2024. Some individual small-cap stocks that are a part of the index have corrected even more in the 15-25% range or higher. As a retail investor in small-cap mutual funds should you be worried about a further correction? What should you do? Let us discuss.
How Have Small-Caps Performed?
The Nifty Smallcap 250 Index has been a star performer in the last one year. The index has given a mind-boggling 67.69% return (as of 29th February 2024) in the last one year. The returns have been higher than the large-caps (Nifty 50 Index) and the mid-caps (Nifty Midcap 150 Index). The returns in the last five years have been a staggering 24.98% CAGR.
Nifty Smallcap 250 Index – One-Year Performance

(Source: https://trendlyne.com/equity/910398/SMALLCA250/nifty-smallcap-250/)
Note: The above data is as of 21st March 2024
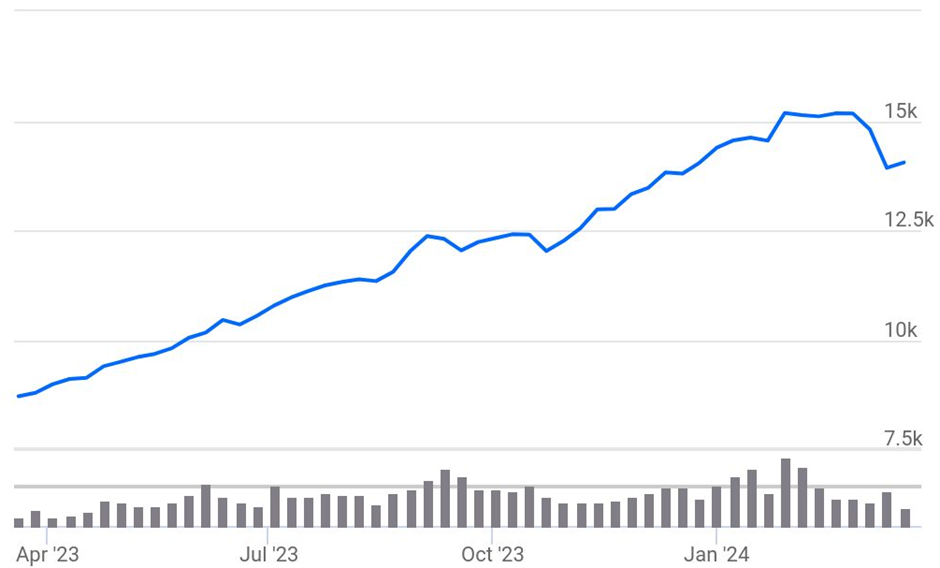
The above chart shows how the Nifty Smallcap 250 Index has moved from a level of 8,820 (as of 21st March 2023) to 14,047 (as of 21st March 2024) in the last one year.
Due to the phenomenal returns in the last one year, many retail investors have been pouring money into small-cap funds. They are hoping the overall market rally will continue and the small-cap funds will keep outperforming. As per AMFI data, in February 2024, small-cap schemes got an inflow of Rs. 2,922 crores compared to mid-cap schemes inflows of Rs. 1,808 crores and large-cap schemes inflows of Rs. 921 crores.
As per AMFI data, in February 2024, the total AUM of small-cap schemes reached Rs. 2.49 lakh crores compared to mid-cap schemes AUM of Rs. 2.95 lakh crores and large-cap schemes AUM of Rs. 3.05 lakh crores. So, the overall AUM of small-cap schemes is closing in on the AUM of mid-cap and large-cap schemes.
Sebi Raises Concerns About Mid and Small-Cap Schemes
Looking at the run-up in the small-cap segment valuations and the huge inflows by retail investors in small-cap schemes, SEBI and many market experts have raised concerns. As per SEBI directions, AMFI asked AMCs to conduct stress tests on mid and small-cap schemes.
A mix of international factors (wars, high interest rates) and domestic factors (high valuations, upcoming elections, SEBI concerns on valuations) have led to a correction in small-caps. From the all-time high levels (15,489) hit on 7th February 2024, the Nifty Smallcap 250 Index has seen a correction of around 10% as of 21st March 2024. So, as a retail investor, should a 10% correction worry you? It shouldn't, as such intra-year corrections are common.
10-25% Intra-Year Corrections in Small-Caps Happen Almost Every Year
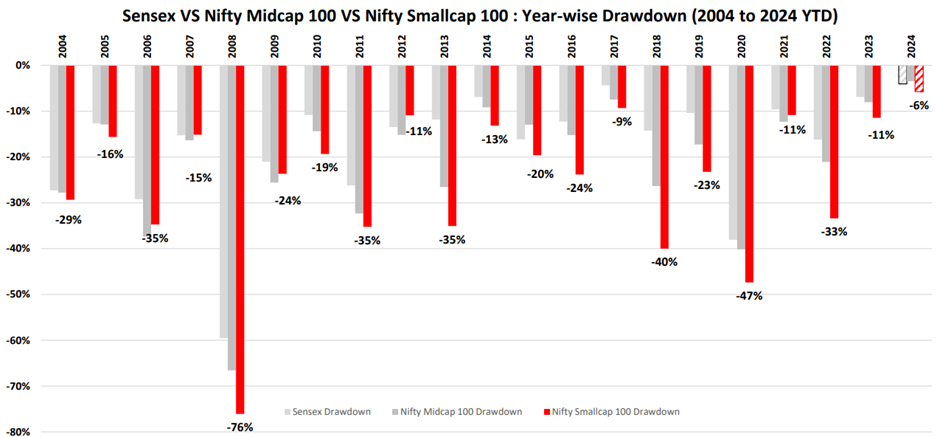
Small-caps are a lot more volatile compared to mid and large-caps. As a result, small-caps see an intra-year correction of 10-25% almost every year.
Small-Caps: Intra-Year Corrections

(Source: https://www.fundsindia.com/blog/wp-content/uploads/2024/03/FundsIndia-Wealth-Conversations.pdf)
Note: The above data is as of 29th February 2024
The above chart shows how the Nifty Smallcap 100 Index is more volatile compared to the Sensex and the Nifty Midcap 100 Index. Infact, in the last 20 years (2004 to 2024), there is only one year (2017) when the Nifty Smallcap 100 Index saw an intra-year fall of less than 10%. In 2017, the intra-year fall was 9%.
In most years, the intra-year fall has been in the 10-25% range. Infact, in 7 of the last 20 years, the intra-year fall has been huge in the 29-47% range. In 2008, the intra-year fall was the highest at 76%.
So, if the 2024 fall of 10% was not enough, should the intra-year falls of 10-25%, almost every year, alarm you? Not really. Let us understand why.
Year-End Recovery From Intra-Year Falls
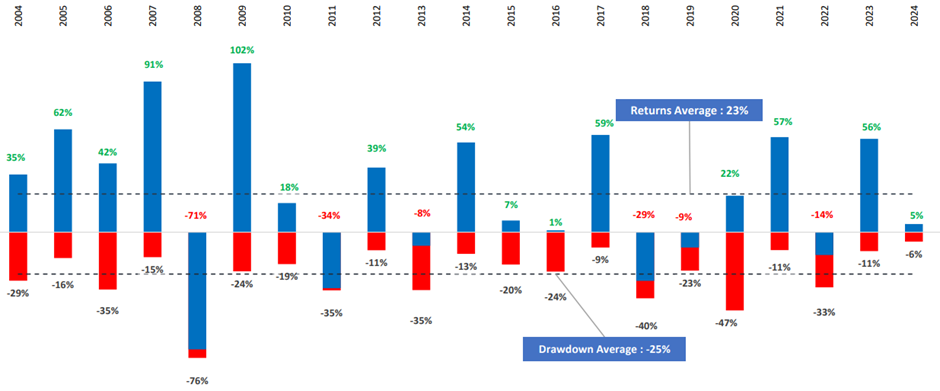
In the earlier section, we saw how the Nifty Smallcap 100 Index sees an intra-year fall of 10-25% almost every year. However, in most years, there is a recovery by the end of the year, and the index ends with positive returns.
Nifty Smallcap 100: Intra-Year Falls and Recovery

(Source: https://www.fundsindia.com/blog/wp-content/uploads/2024/03/FundsIndia-Wealth-Conversations.pdf)
Note: The above data is as of 29th February 2024
The above table shows that even after a big intra-year fall, in 3 out of 4 years, the Nifty Smallcap 100 Index ended the year with positive returns. In 14 out of the last 20 years (2004 to 2024), the Nifty Smallcap 100 Index ended the year with positive returns.
Even if the returns have been negative for a particular year, the index has given positive returns in the following year, except for one occasion. In only one instance (years 2018 and 2019), the Nifty Smallcap 100 Index has given negative returns for two consecutive years. In 10 of the last 20 years, the index has given high returns of more than 35 years.
How to Realise the Full Potential of Small-Caps?
In the above section, we saw how the Nifty Smallcap 100 Index experiences big falls intra-year almost every year. But we also saw how the index recovers and ends with positive returns in three out of every four years. Hence, you shouldn't panic at all with the current intra-year (2024) fall of 10% in the small-cap index. To benefit from the potential high growth of small-caps, you should do two things:
- Always invest in small-caps with a long-term investment horizon
- Invest through the systematic investment plan (SIP) route
Invest for the Long-Term
You should invest in small-cap mutual fund schemes only when your investment time horizon is more than 5-7 years. Such a long period gives your investment time to go through multiple business cycles of boom and bust and realise the full potential of small-caps. In the long run, you can benefit from the power of compounding and create wealth for yourself.
Small Cap Index Performance in the Long Run

(Source: https://www.niftyindices.com/Factsheet/ind_niftysmallcap100.pdf)
The above Nifty Smallcap 100 Index chart shows how in the long run, inspite of all the intra-year corrections, small-caps have created wealth for investors. From the base date of 1st March 2004 to date (March 2024), the Nifty Smallcap 100 Index has moved from the base value of 1,000 to the current level of 15,000.
In the last 20 years, the index has multiplied investor wealth by a whopping 15 times, despite all the volatility and the huge intra-year corrections. Hence, you should always invest in small-caps with a long investment tenure of more than 5-7 years.
Invest Through the SIP Route
When you invest through the SIP route, your purchase price gets averaged over a long period. During market corrections, the mutual fund NAV falls, and you will accumulate more units of the scheme with every SIP installment. On the other hand, when the market starts going up, the value of all the units accumulated during the downturn increases, and your overall portfolio value rises.
Map Your Investments to Your Financial Goals
Before investing, you should consult an investment expert and get a comprehensive financial plan made for all your financial goals. Once you have a financial plan, you can map all your investments to your financial goals. When you invest with a financial goal in mind, you can stay focused on it till the goal is achieved. When you are focused, you can cut out the noise, like how media houses are screaming about the current small-cap correction of 10%, terming it a market crash or doomsday!
Your Investing Experts
Relevant Articles
Why Mid-Cap Allocation Needs More Discipline Than Large Cap
Mid-cap allocation demands more discipline than large cap because it comes with sharper market swings. While mid caps offer higher long-term growth potential, they also test investor patience during downturns. The key is not choosing one over the other, but understanding how each behaves across market cycles.
Why Return-Focused Investing Fails in Volatile Markets
Return-focused investing fails in volatile markets because it relies on recent performance as the primary decision-making anchor. When markets fluctuate sharply, investors who chase returns tend to react emotionally switching funds, exiting prematurely, or increasing risk at the wrong time. Over time, these reactions interrupt compounding and damage long-term wealth creation.
What Is NAV in Mutual Fund? A Simple Guide to Understanding Net Asset Value
If you are trying to understand what NAV in mutual fund investing means, the answer is simple: NAV, or net asset value, represents the per-unit value of a mutual fund’s portfolio after deducting its liabilities. It tells you how much each unit you hold is worth at the end of a trading day. It does not indicate whether a fund is cheap, expensive, or better than another, it is simply a daily valuation measure.


.png)
